Introduction
When implementing compact, stand-alone projects, one always encounters the problem of combining a cost-effective solution with the requirements of operation, clarity and reporting.
On the following pages a solution to this problem will be shown.
Visualization
One part of the system is the visualization and user interface. The visualization is based on the platform of the widely used and very stable product GefaSoft.
It is delivered with a Software Key, which contains the license and runs on a Windows operating system. Only one license is needed for the runtime and the graphic editor. The integrated communication driver establishes the connection to the PLC.
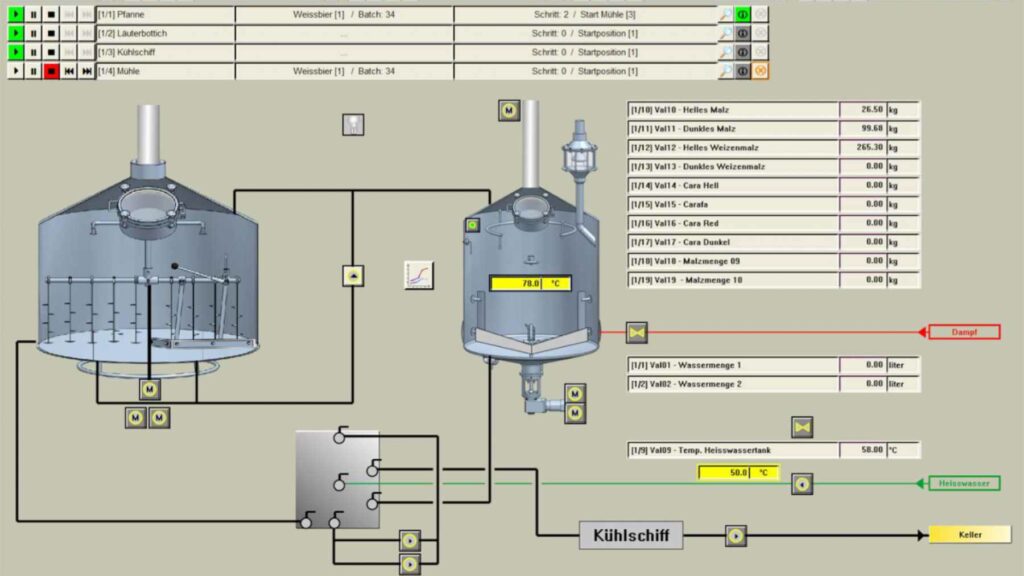
Properties of the Visualization
- Multiple languages
- Single or multiple workstations
- Usable with touch panels, computer monitors, tablets, double screening
- Included communication driver to PLC
- Included editing tool – no extra runtime license needed!
- Included object library for quick editing
- Included recipe editor
- Included batch protocol
- Included alarm, event and handling protocol
- Included graphic trending for analogue and digital values
- Automatic backup for trends and protocols – if needed also onto external drives
- Build in SQL-Database
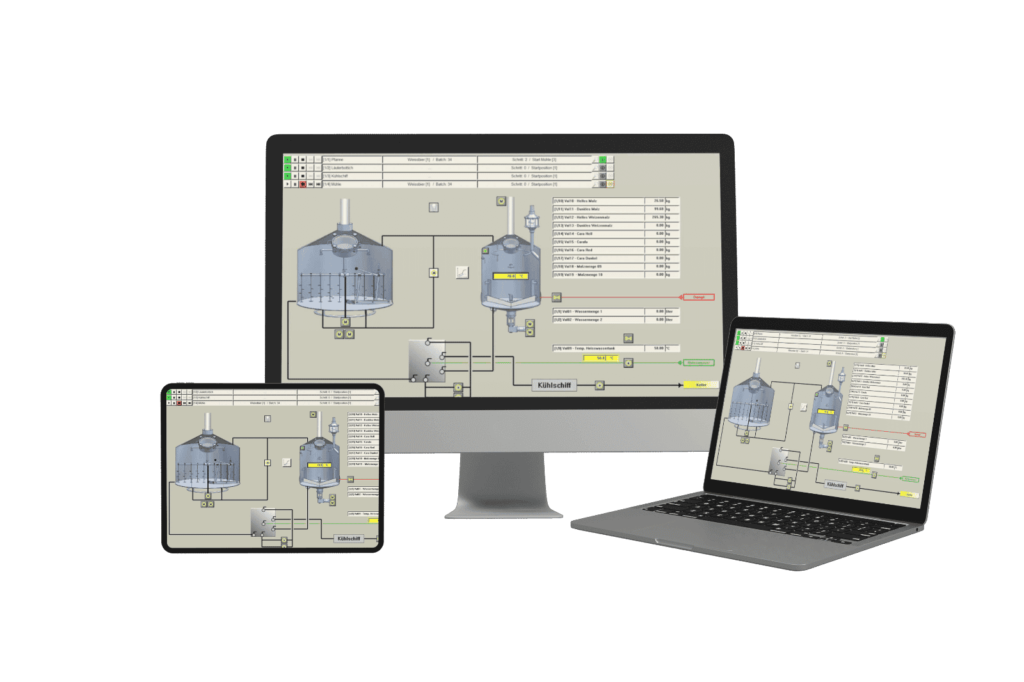
Workstation
The workstation can be any computer system like:
- a panel-PC (Touchscreen)
- a desktop-PC
- a tablet
As soon as more than one workstation is implemented, a redundancy can be established.
Redundancy prevents loss of data and guarantees throughout workability.
PLC FRAME
- Up to 100 Production Units
- Up 250 Steps per unit possible
- Highly structured
- Readable and easy to follow program code
- Prepared functions for actuators, P&ID’s, VLT’s, measured values, counters etc.
- Prepared step organization
- Clear and easy to handle interface structures for communications
- Clear and easy to handle class processing for a fast commissioning
- Quick to learn
- Prepared for Step7 or TIA Portal
- Images are well and clearly structured
- All needed information stays in one picture
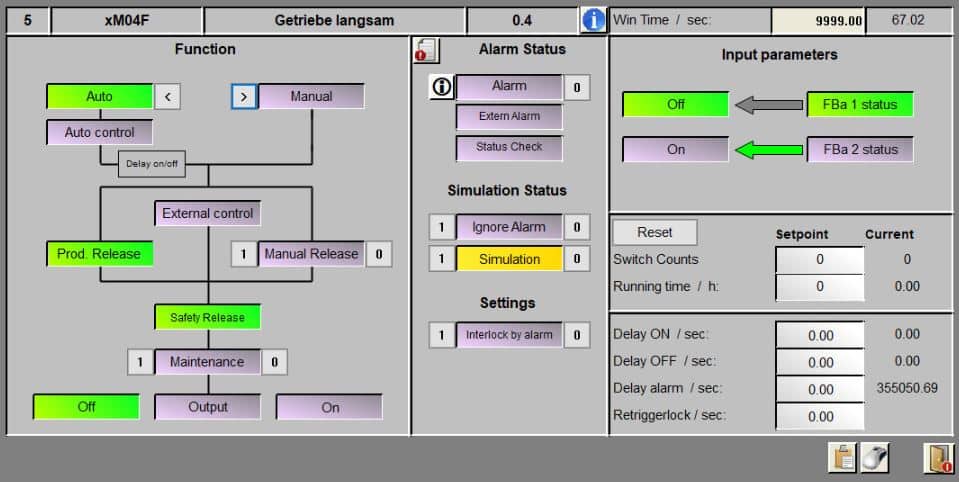
- Control modules can be set up by editing values in their faceplates
- Adaptions to control modules can be made from the surface, without a programmer on site
Configuration
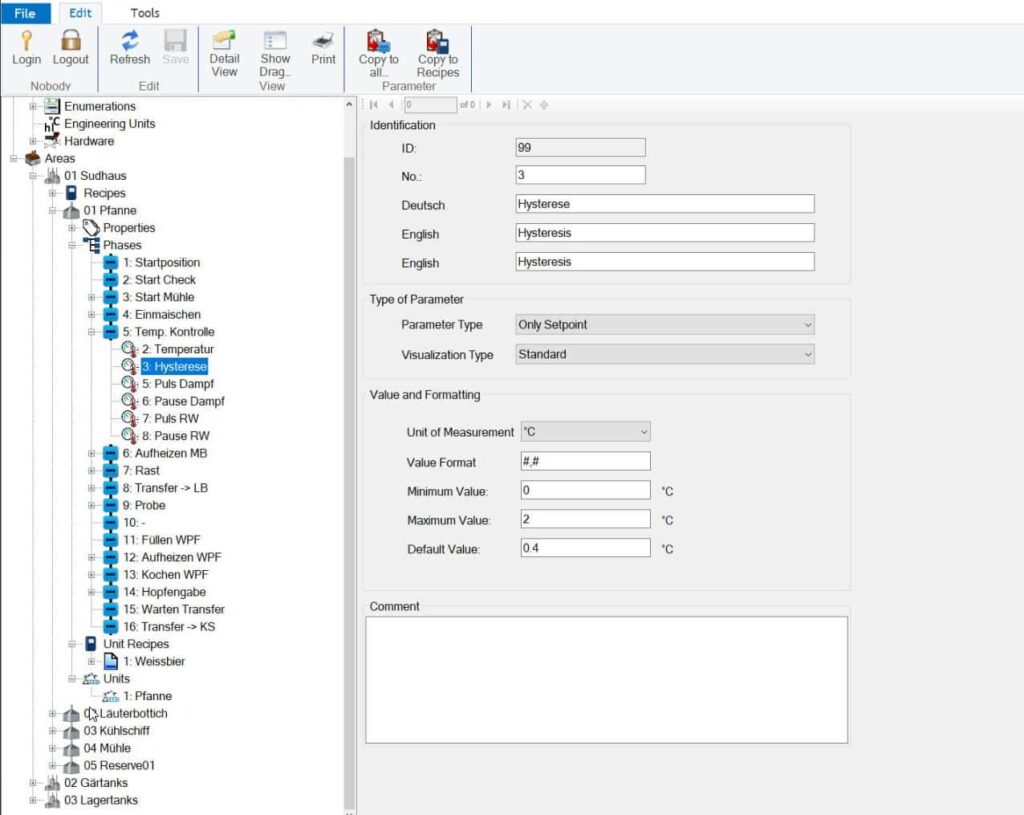
In the configuration, the basic setup for units is done and the phases, properties, recipes and control modules are assigned to a unit.
It is also possible to set individual limits for every parameter.
Copying parameters from phase to phase or phases from unit to unit can easily be done by drag and drop.
Recipe editor
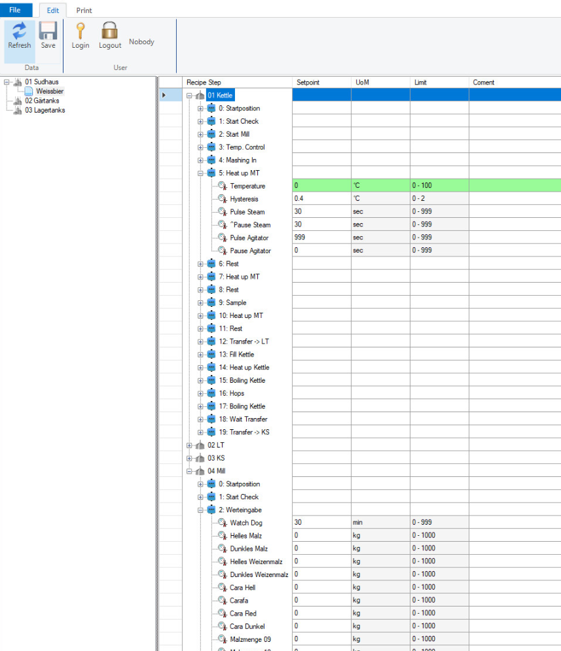
With this editor it is easy to select the respective unit, recipe and step to adjust any value available.
Starting on the left side you select unit, recipe and step to adjust the desired values like times, flows, temperatures etc.
Every step of the recipe will have an assigned phase that can have different values, even if used several times within the same recipe.
So setting up a recipe is an easy task for any shift leader or director, depending on the access level of the user.
Batch protocol
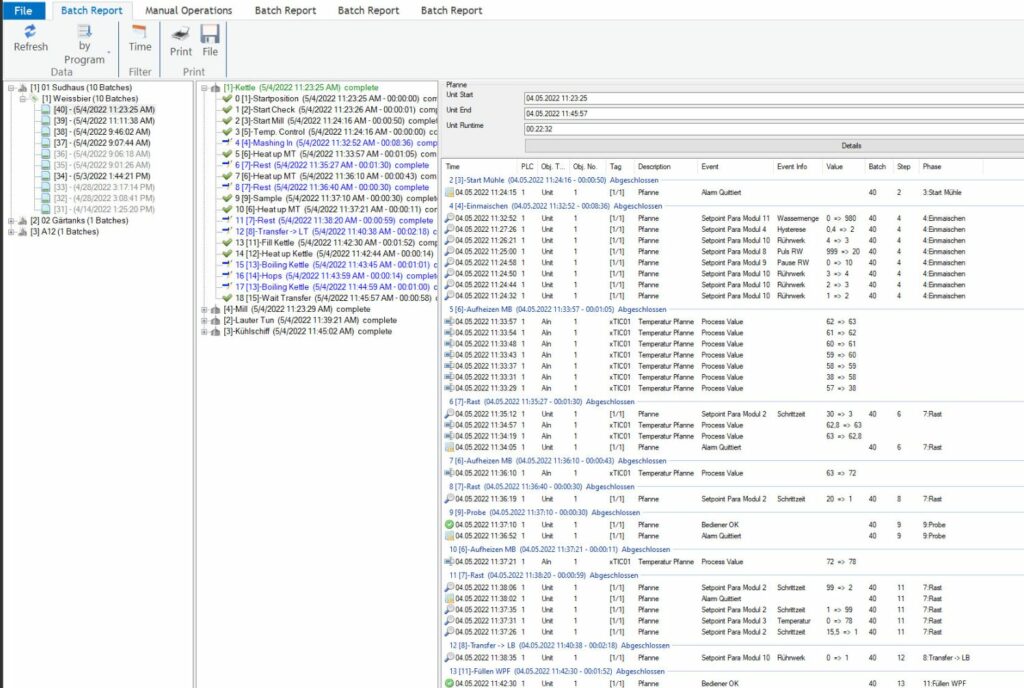
The batch protocol gives the company access to historical data of all production-relevant and measurable parameters as well as quality-oriented information.
With this tool, it is therefore easy to track the cleaning regime, for example, and check for any problems that might have occurred. Also all changes to the parameters that were done during the running recipe are displayed.
In addition, it is possible to show a timeline analysis including all steps of all units that are included in the batch.
Alarm protocol
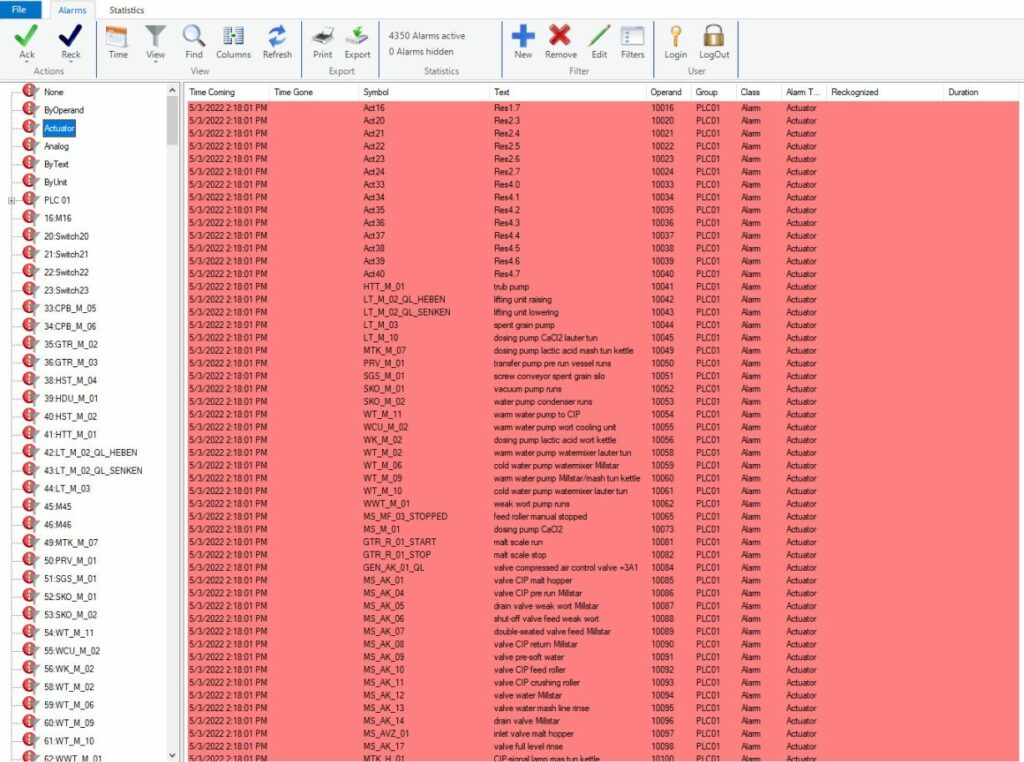
The alarm protocol gives the staff access to current and historical data of problems that occurred. This could be valve failures as well as alarm messages produced by the process, such as watch dog times or operating mistakes.
Handling protocol
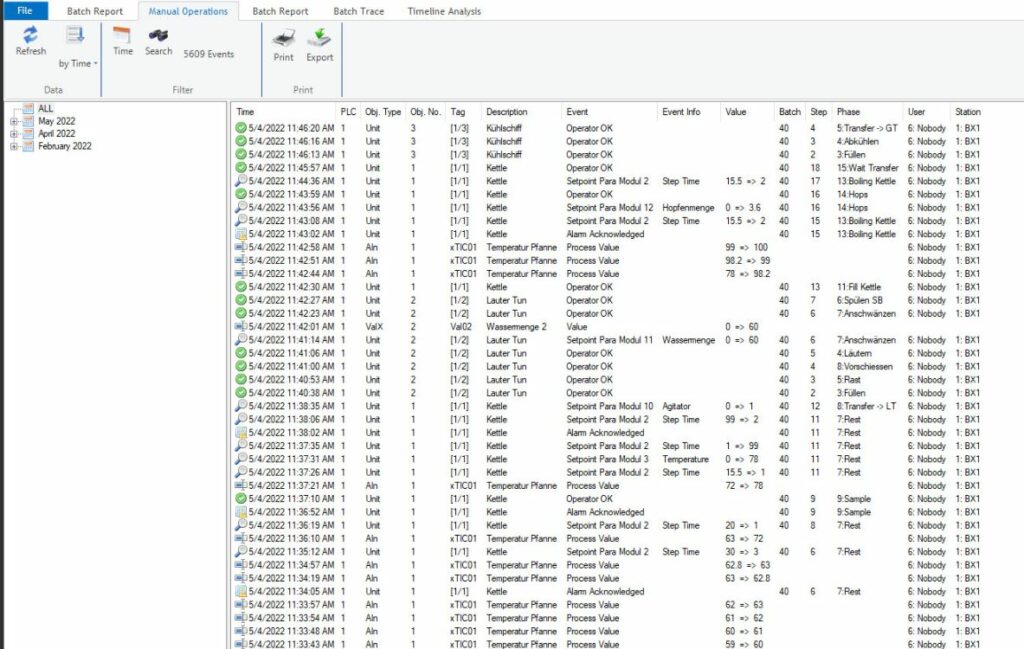
The handling protocol gives the staff access to current and historical data of operations. This could be manual or automatic activation of valves/pumps, the manipulation of switches by an operator, the change of parameters or the change of a status of units.
Graphic Trending
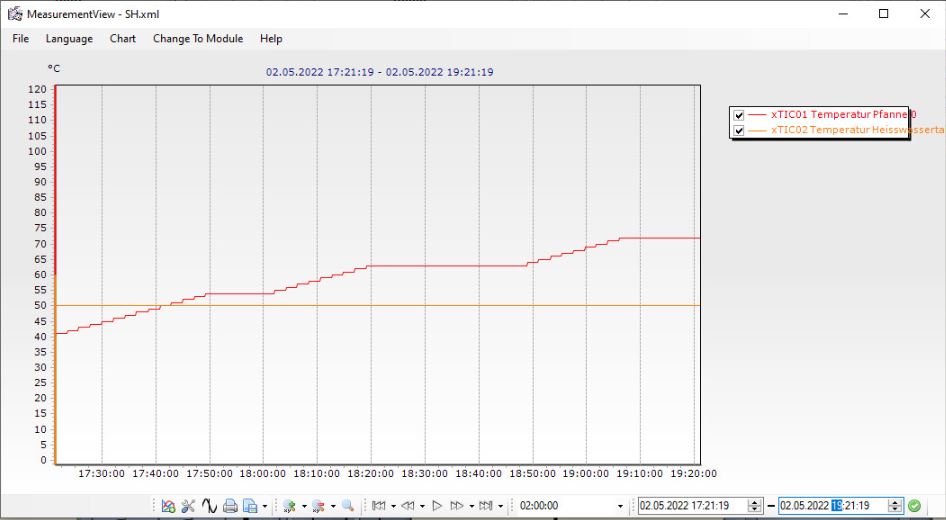
Graphic Trends can contain analogue and digital signals. But also step texts can be displayed to assign the graphical values to a specific activity.
Depending on preferences, a project can hold prefabricated trend-pictures or trends created by operators or shift leaders.
Automatic Backup system
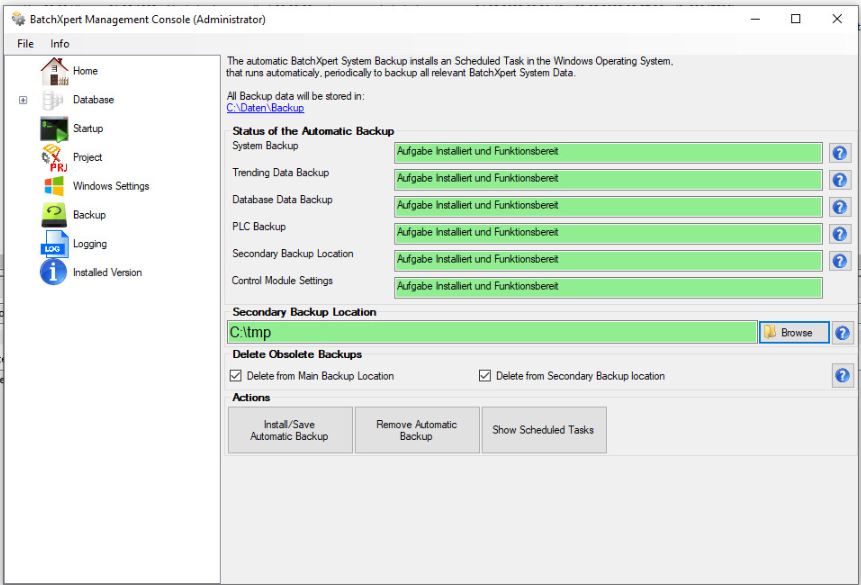
To prevent the loss of data, an automatic backup system is integrated. All data for visualization, configuration and PLC is saved by scheduled task. The intervalls can be adjusted.
This product has its focus on all projects, therefor its frame contains the essential musts for the system itself but gives the user everything he needs for his daily tasks including protocols and a recipe editor without additional costs.
By keeping the system light and highly structured, editing it can be taught very quickly.

